Difference between revisions of "General Information/IS Identification"
| Line 6: | Line 6: | ||
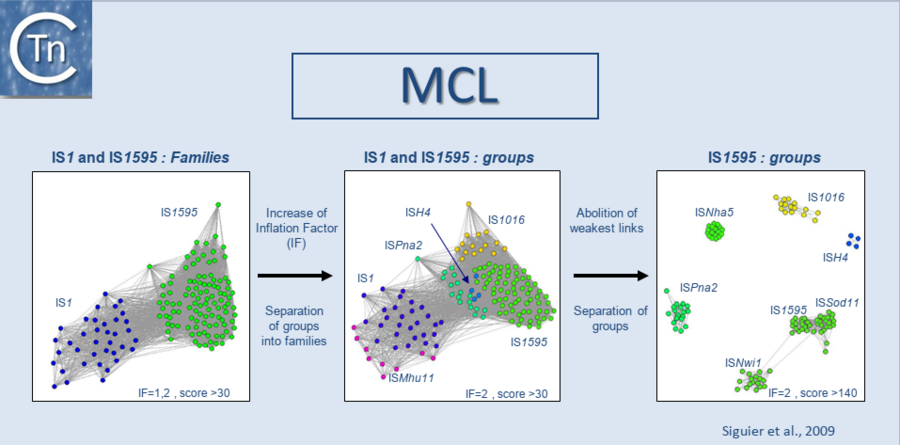
[[Image:1.5.1.png|thumb|center|900px|Fig1.5.1 Results of Markov Cluster (MCL) Analysis. | [[Image:1.5.1.png|thumb|center|900px|Fig1.5.1 Results of Markov Cluster (MCL) Analysis. | ||
| − | Each circle represents an individual IS transposase amino acid sequence. a) Inflation factor of 1.2, score >30 (links with scores of less than 30 were removed). IS<i>1</i> family: blue circles. IS<i>1595</i> family: green circles. b) The inflation factor of 2 increases stringency and separates each major group into groups. The IS<i>1</i> family generated the IS<i>Mhu11</i> group (magenta). The IS<i>1595</i> family separated into four groups: IS<i>1595</i> <span style="color:#FFFFFF; background:#008000">(green)</span>, IS<i>1016</i> <span style="color:# | + | Each circle represents an individual IS transposase amino acid sequence. a) Inflation factor of 1.2, score >30 (links with scores of less than 30 were removed). IS<i>1</i> family: blue circles. IS<i>1595</i> family: green circles. b) The inflation factor of 2 increases stringency and separates each major group into groups. The IS<i>1</i> family generated the IS<i>Mhu11</i> group (magenta). The IS<i>1595</i> family separated into four groups: IS<i>1595</i> <span style="color:#FFFFFF; background:#008000">(green)</span>, IS<i>1016</i> <span style="color:#000000; background:#ffff00">(yellow)</span>, IS<i>Pna2</i> <span style="color:#FFFFFF; background:#0000ff">(blue</span>-<span style="color:#FFFFFF; background:#008000">green)</span>, and IS<i>H4</i> <span style="color:#000000; background:#00ffff">(light blue)</span>. c) Gradually reducing the weakest links between groups (Inflation factor 2, score >140) further divided the IS<i>1595</i> family into 4 additional groups (IS<i>1595</i>, IS<i>Sod1</i>, IS<i>Nwi1</i>, and IS<i>Nha5</i>).]] |
<b>Bibliography</b> | <b>Bibliography</b> | ||
Revision as of 19:03, 28 April 2020
The families in ISfinder are defined using an initial manual BLAST analysis often followed by reiterative BLAST analyses with the primary transposase sequence of representative elements used as a query in a BLASTP[1] search of microbial genomes. Potential full-length Tpases are retained and that with the lowest score then used as a query in a second BLASTP search. This is continued until no new potential candidates are detected. The ClustalW multiple alignment algorithm[2] is then used and the results displayed using the Jalview alignment editor[3] for assessment. The corresponding DNA together with 1000 base pairs up- and down-stream is then extracted and examined manually for the IRs or other typical features such as secondary structures and flanking DRs. This, together with a comparison of the DNA extremities of various elements, allows identification of both ends of the collected elements. In cases where more than a single IS copy is identified, BLASTN can be used to define the IS ends. Where only a single copy is found, the ends can often be defined by identifying and comparing it with empty sites.
In a second step, we use the Markov Cluster Algorithm (MCL) (http://micans.org/mcl/)[4] to weigh the relationships between clusters of ISs and to validate prior ISfinder classification of ISs into families and subgroups[5]. This is explained in detail in [6] and is based on the parameters used in the MCL (Fig.1.5.1) in addition to characteristics such as the specificity of target site duplications, the detailed sequence of the ends, genetic organization. It should be understood that the distinction between families and subgroups can evolve as the number of ISs in the database increases. Several semi-automatic IS annotation pipelines are now available. The interested reader is directed to three of these: ISsaga[7] which is now integrated into the ISfinder platform[8], ISScan[9] and Oasis[10]. At present, de novo prediction of ISs is not efficient and these pipelines all employ the ISfinder database to function. While all three pipelines permit identification of IS fragments as well as full length ISs, a certain level of manual assessment is essential.

Bibliography