Difference between revisions of "General Information/IS History"
| Line 9: | Line 9: | ||
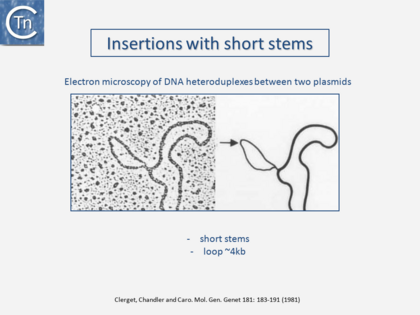
<br />[[File:1.2.2.png|link=https://tncentral.ncc.unesp.br/TnPedia/index.php/File:1.2.2.png|alt=|thumb|420x420px|'''Fig.2.2.''' Electron microscopy showing Insertions with short stems. Part of a heteroduplex molecule formed between plasmids R100.1 and Rldrdl9 showing a single-stranded insertion loop of the ampicillin resistance transposon Tn''3'' carried by plasmid Rldrd19 but not by R100.1. In this type of experiment, both plasmids are denatured into their single-strand DNA form, mixed and renatured to form double-stranded DNA where they are complementary and single-strand regions where they do not share sequence homology. (Electron Microscopy by Edouard Boy de la Tour and Lucien Caro). | <br />[[File:1.2.2.png|link=https://tncentral.ncc.unesp.br/TnPedia/index.php/File:1.2.2.png|alt=|thumb|420x420px|'''Fig.2.2.''' Electron microscopy showing Insertions with short stems. Part of a heteroduplex molecule formed between plasmids R100.1 and Rldrdl9 showing a single-stranded insertion loop of the ampicillin resistance transposon Tn''3'' carried by plasmid Rldrd19 but not by R100.1. In this type of experiment, both plasmids are denatured into their single-strand DNA form, mixed and renatured to form double-stranded DNA where they are complementary and single-strand regions where they do not share sequence homology. (Electron Microscopy by Edouard Boy de la Tour and Lucien Caro). | ||
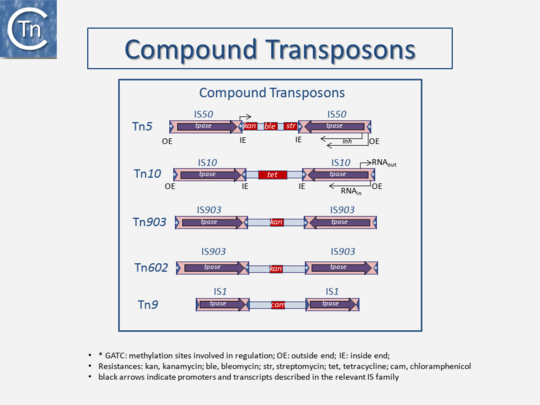
| − | |center]]<br />[[File:1.2.3.png|link=https://tncentral.ncc.unesp.br/TnPedia/index.php/File:1.2.3.png|alt=|thumb| | + | |center]]<br />[[File:1.2.3.png|link=https://tncentral.ncc.unesp.br/TnPedia/index.php/File:1.2.3.png|alt=|thumb|540x540px|'''Fig.2.3.''' Compound Transposons structure schema with examples of transposons Tn''5'', Tn''10'', Tn''903'', Tn''602'', and Tn''9''. |
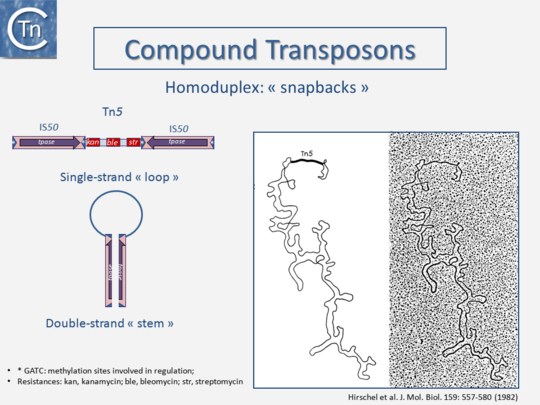
| − | The figure is not to scale. The TE is shown as a pink box; purple arrows, Tpase genes; red boxes, passenger genes; thin arrows, promoters, and transcription direction; dark blue arrows, terminal inverted repeats; white asterisks, GATC Dam methylation sites which are present in some TE and control their level of activity; OE and IE: outside ends and inside ends of the IS with respect to the transposon. This is a generic cartoon showing the general arrangement of flanking IS in several different Tn. Tn''5'' (5818 bp) carries inverted copies of IS''50'' (1534 bp); Tn''10'' (9147 bp) carries inverted copies of IS''10'' (1329 bp); Tn''903'' (3094 bp) carries inverted copies of IS''903'' (1057 bp,); Tn''602'' (3064 bp) carries direct flanking copies of IS''903''. Tpase, Tpase; kan, tet, cam: resistance genes for kanamycin, tetracycline and chloramphenicol respectively; Tn''9'' (2638 bp) carries direct flanking copies of IS''1'' (768bp).|center]][[File:1.2.4.png|link=https://tncentral.ncc.unesp.br/TnPedia/index.php/File:1.2.4.png|alt=|thumb| | + | The figure is not to scale. The TE is shown as a pink box; purple arrows, Tpase genes; red boxes, passenger genes; thin arrows, promoters, and transcription direction; dark blue arrows, terminal inverted repeats; white asterisks, GATC Dam methylation sites which are present in some TE and control their level of activity; OE and IE: outside ends and inside ends of the IS with respect to the transposon. This is a generic cartoon showing the general arrangement of flanking IS in several different Tn. Tn''5'' (5818 bp) carries inverted copies of IS''50'' (1534 bp); Tn''10'' (9147 bp) carries inverted copies of IS''10'' (1329 bp); Tn''903'' (3094 bp) carries inverted copies of IS''903'' (1057 bp,); Tn''602'' (3064 bp) carries direct flanking copies of IS''903''. Tpase, Tpase; kan, tet, cam: resistance genes for kanamycin, tetracycline and chloramphenicol respectively; Tn''9'' (2638 bp) carries direct flanking copies of IS''1'' (768bp).|center]][[File:1.2.4.png|link=https://tncentral.ncc.unesp.br/TnPedia/index.php/File:1.2.4.png|alt=|thumb|540x540px|'''Fig.2.4.''' Compound Tn''5''.The Left-hand panel shows the structure of Tn''5'' and the way in which the flanking inverted IS''50'' insertion sequences would form a double-strand stem on denaturation and renaturation. |
The Right-hand panel shows the structure of plasmid pOX38:: Tn5 as revealed by electron microscopy. Plasmid DNA was denatured and renatured o form a snap-back structure that locates the Tn''5'' insertion. (Electron Microscopy by Edouard Boy de la Tour and Lucien Caro). | The Right-hand panel shows the structure of plasmid pOX38:: Tn5 as revealed by electron microscopy. Plasmid DNA was denatured and renatured o form a snap-back structure that locates the Tn''5'' insertion. (Electron Microscopy by Edouard Boy de la Tour and Lucien Caro). | ||
Revision as of 19:42, 9 August 2020
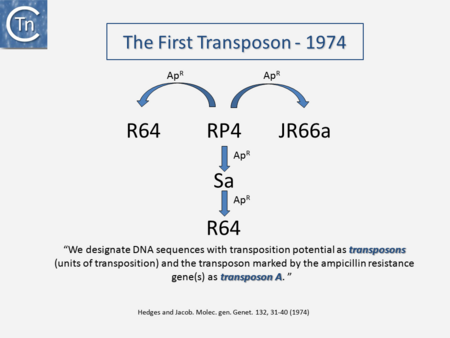
It is now over 40 years since the first IS were described. They were identified as short DNA segments found repeatedly associated with mutations in the gal operon and bacteriophage λ �[1–3]�. Shortly after, it was established that IS were normal residents of the Escherichia coli chromosome �[4]� sometimes present in multiple copies. They were shown to be involved in generating deletions �[5]� and in activating gene expression �[6,7]�. They were also identified as constituents of bacterial plasmids �[8–10]�. At about the same time, it was observed that antibiotic resistance genes could also be transferred or “transposed” from one plasmid to another �����[11–13]� (Fig.2.1) and it was recognized that IS and “transposons” (a term originally coined by Hedges and Jacob �[14]�) were both members of a group of genetic entities: Transposable or Mobile Genetic Elements (TE or MGE).
Transposons and IS were identified by electron microscopy of heteroduplexes between plasmids or phage with and without the insertion or by homoduplexes (Fig.2.2 and Fig.2.4; e.g �[15,16]�)
This relationship between IS and transposons was reinforced by the observation that different DNA segments carrying different genes could be translocated by two flanking IS (compound transposons) �����[17–19]� (Fig.2.3and Fig.2.4). In many compound transposons one of the IS is inactivated or has reduced activity due to mutation. This tends to increase the coherence of the transposon in comparison to the autonomous activity of the individual IS. For example, in Tn5, the inside end (IE) of the left IS50 carries a mutation which both creates a better promoter sequence to drive expression of the resistance genes and introduces a UAA nonsense codon at the 3’ end of the transposase gene �[20,21]�. In the case of Tn10, the left IS10 differs from the functional right IS10 at a number of nucleotide positions in both in its regulatory region and in the transposase �[22]�. On the other hand, not all composite transposons possess an inactive copy of the flanking IS. In Tn9, flanked by two directly repeated copies of IS1, both IS are active Chandler �[23,24]�.
It was also realized �[25]� that IS might be related to the controlling elements discovered by genetic analysis of maize several decades previously ���[26–28]�. However, in spite of the observation that IS can be present in some bacterial species in extremely high copy numbers �����[29,30]�, little at the time prepared us for the subsequent recognition of the preponderant role they play in shaping genomes, of their extreme diversity and their widespread distribution (see reference �[31]�)(Fig.2.5).
Early Transposition Models
The unexpected recombination properties of transposable elements which were accumulating in the mid- to late-1970s led to a flurry of molecular models published between 1978 and 1981. Many of these independently derived models shared common features, a result that reflects the delays in communicating ideas, manuscripts and journals in a pre-internet age. They were developed to explain properties such as the absence of a requirement for extensive homology between donor and target and independence from RecA �[32,33]�, generation of short direct flanking repeats of target DNA (e.g.�[34]�), adjacent deletions and other transposon-induced DNA rearrangements �[25,35–38]� and, in the case of Tn3 and bacteriophage Mu, transposition-associated replication.
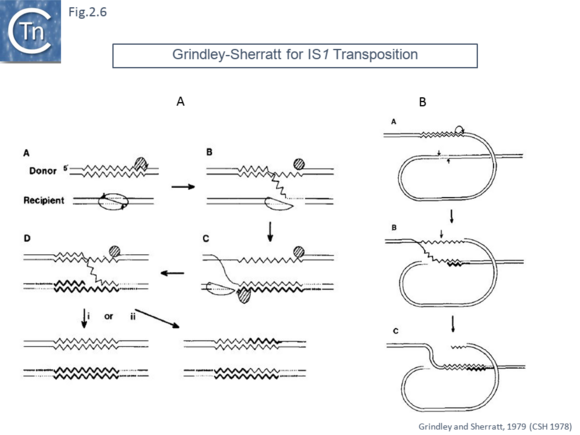
The first model published in 1979 in a volume of Cold Spring Harbor Symposia on Quantitative Biology from a symposium in 1978 �[39]�. This model �[40]� was designed to explain the 9 base pair target duplication observed following insertion of IS1. It included both non-replicative and replicative proposals. In the replicative model (Fig.2.6 A), the target undergoes a double strand staggered cleavage to prepare for generating the direct flanking target repeats and one transposon strand is transferred and copied into the target. Following completion, replication of the second transposon strand occurs in the target. The model also showed how deletion intramolecular transposition could generate adjacent deletions (Fig.2.6 B).
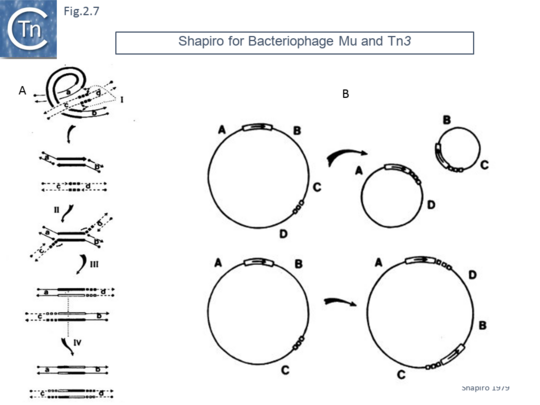
This model was soon followed by a replicative transposition model which included a step in which both donor and target replicons underwent fusion to form a “cointegrate” �[41]� (Fig.2.7 A). This is generated by cleavage of a single strand at each transposon end, attack of the target in a staggered way and re-joining to generate an intermediate (often called a “Shapiro” intermediate) in which both donor and target replicons are joined via a single Tn copy in a branched structure. The branched DNA forms two potential replication forks which are used to duplicate the transposon generating an intermediate in which a circular fused donor-target carries a directly repeated transposon copy at each junction. This was then proposed to “resolve” by recombination between the two transposon copies resulting in regeneration of the original donor and creating a target molecule containing a transposon copy. The model also explained how this type of transposition, if it occurs into an intramolecular target, could result in deletions and inversions (Fig.2.7 B).
Although the 1978 Symposium included only a short section on transposable elements, the 1980 Symposium �[42]� was dedicated entirely to Moveable Genetic Elements. One proposition published in this volume included a simple modification of the replicative cointegrate model, single second strand cleavage of the non-transferred strand at each end, to explain conservative (non-replicative) transposition �[43]�.
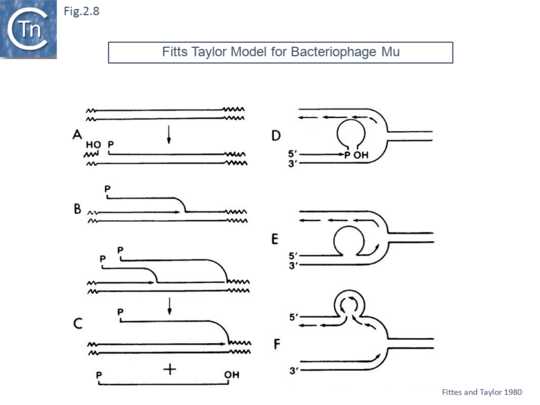
Another model, published in 1980, was designed to take into account the observation that bacteriophage Mu appeared to target replication forks �[44]�. In this model (Fig.2.8)., phage Mu was proposed to replicate in situ (i.e. from its integrated location as a prophage following cleavage at one end and replication using the flanking 3’OH host DNA as a primer. A single strand phage intermediate was then proposed to invade a nascent replication fork (possibly by using interactions between a phage encoded protein and a component of the fork – as transposon Tn7 has subsequently been shown to do).
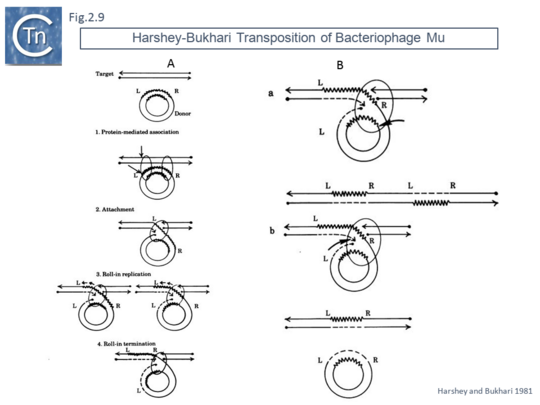
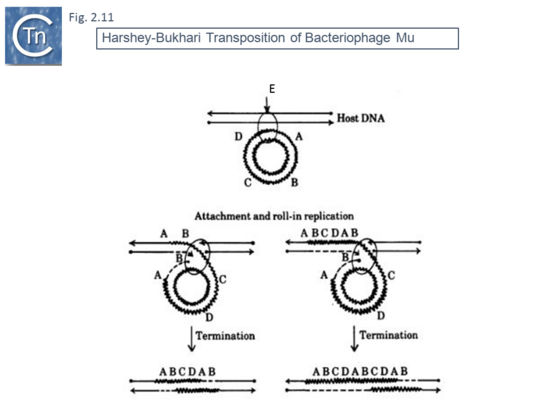
This volume also included, as an appendix, another replicative transposition model to explain transposition of bacteriophage Mu �[45]�. This was later published as a full article �[46]�. The essential elements of this model were based on the results of electron microscopy analysis of DNA following induction of Mu transposition in vivo. This model (Fig. 1.2.9A) proposed an initial protein-mediated association between the target molecule and a circular Mu copy, followed by, what the authors called “attachment” (now called strand transfer) involving a single strand nick on the transposon and transfer of the end to a target DNA which had undergone double strand cleavage. The free 3’OH on the cleaved target molecule could then serve as a primer for “roll-in” replication and, when reaching the second transposon end, “roll-in” termination then occurs. The model also provided an explanation the formation of cointegrates and simple transposition by the choice of strand cleavage and transfer at the termination step (Fig. 1.2.9B); for inversion (Fig. 1.2.9C) and deletion (Fig. 1.2.9D) of DNA by intermolecular transposition events; and for the occurrence of tandem multimer inserts when roll-in termination fails to occur and replication continues for another round (Fig. 1.2.9E).
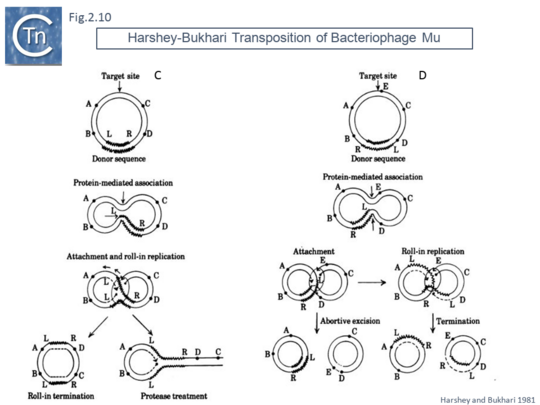
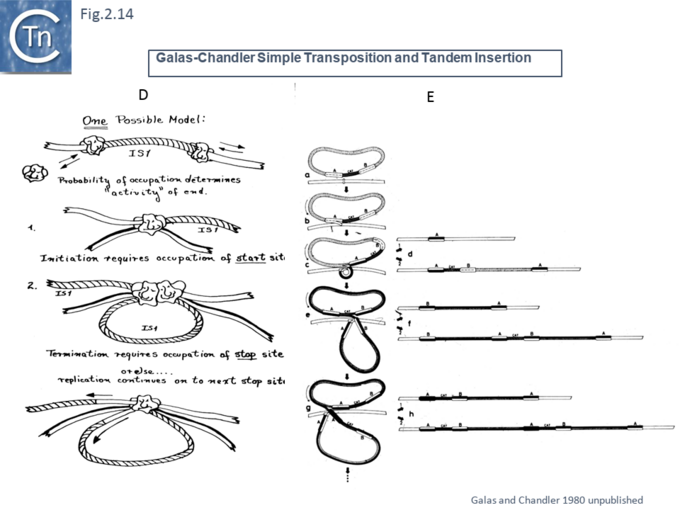
Another very similar model was published in the same journal later that year �[47]� (Fig. 1.2.10). This was built to explain observations that the frequency of transposition of IS1-based compound transposons appeared to decrease exponentially as a function of increasing size �[16]�. This model provided a mechanism for alternative pathways of cointegrate formation and direct transposition which simply depended on which of the two strands at termination were exchanged (Fig. 1.2.10A and B), how individual IS transposition or transposition of the entire compound transposon might occur (Fig. 1.2.10C) and with the same idea (failure to terminate), how tandem transposon copies could be inserted (Fig. 1.2.10D and E).
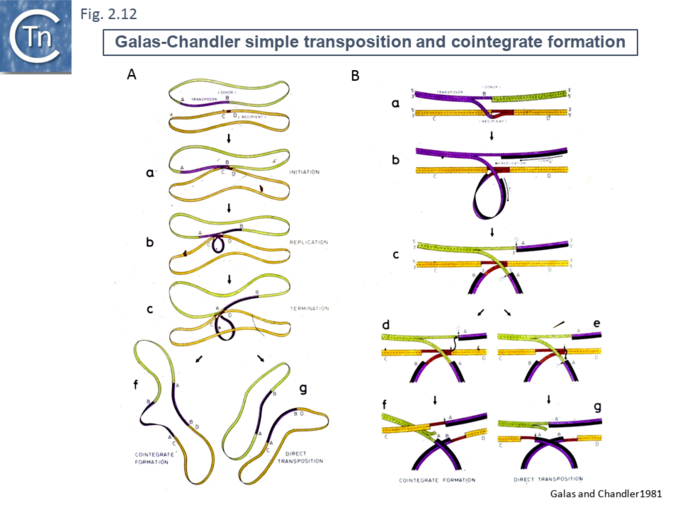
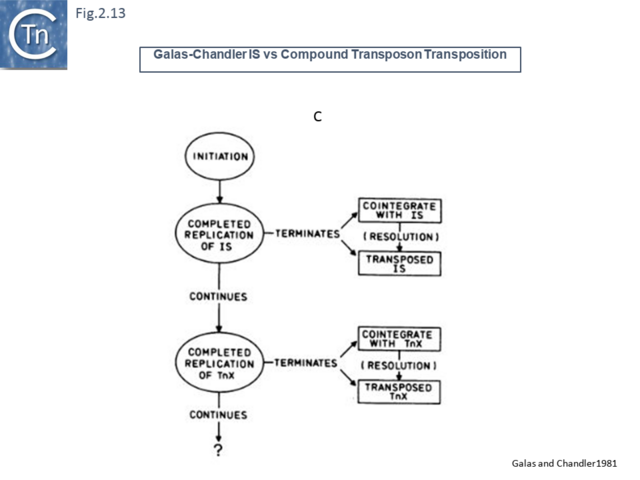
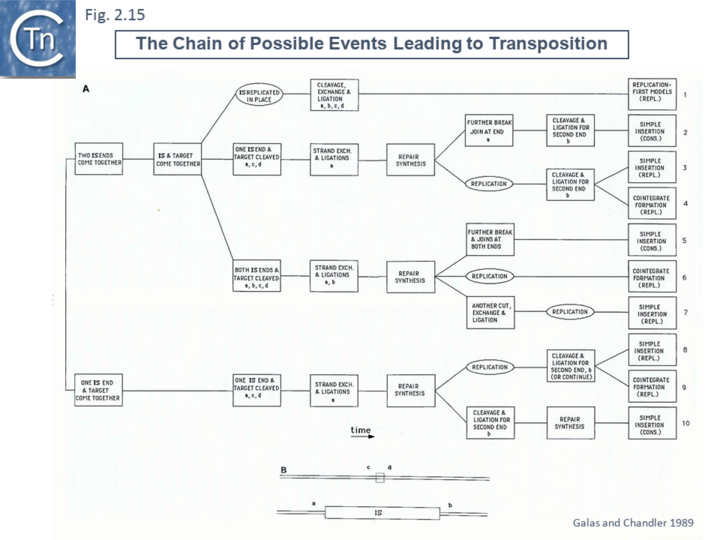
Formally, these models can all be simply classed by a series of reactions whose order can be varied �[48]� (Fig. 1.2.11). Note that these did not foresee the large diversity in transposition reactions to generate circular transposon intermediate or the detailed cleavages and interstrand reactions discovered later (see section…..).
We would like to thank David Sherratt (University of Oxford), Rasika Harshey (University of Texas at Austin) and Jim Shapiro (University of Chicago) for permission to use their original figures. We would also like to thank David Galas (Pacific Northwest Research Institute) for permission to use his unpublished drawings.
